Understanding customer feedback via Artificial Intelligence and Natural Language Processing To stay successful and grow, businesses need to make wise decisions based on qualified and effective analyses of the right data. An increasing amount of data comes from the customers via social media and recommendation sites in the form of post-visit reviews, posts, and mentions….
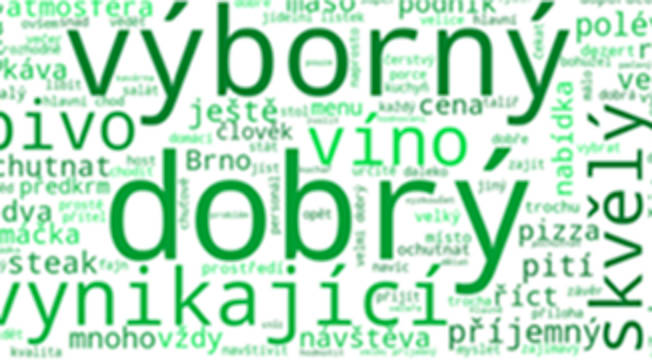
How to find the best restaurant using sentiment analysis
IT students used our API in their projects. Learn about their experience of performing sentiment analysis to find the best restaurant in town. Read more…

How to speed up e-shops’ customer support
IT students used our API in their projects. See how they analyzed an e-shop’s emails to find the ones that are important and filtered out automatic messages and spam to make it easy for the e-shop to address customers’ concerns faster. Read more…

Analyzing customer feedback in e‑commerce
Covering new trends in e-commerce, FEEDIT.CZ introduced Geneea to its readers among several other emerging solutions offering AI-based advanced text analysis that are available to the quickly growing local e-commerce sector. Read more…
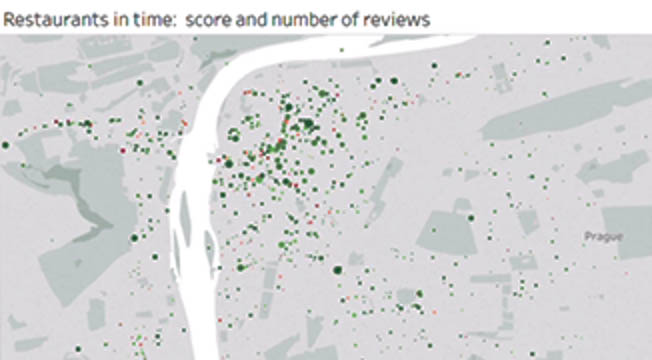
Would you trust AI to recommend you a place to eat?
IT students used our API in their projects. Find out how they discovered the best restaurants in Prague by analyzing real customer reviews, proving that data analysis can help people make good, conscious decisions. Read more…
Machine learning for recommender systems
Pavel Kordik, CEO of Recombee, explains how deep learning is revolutionizing the field of recommender systems, and describes Recombee’s collaboration with Geneea. Read more…

Identifying trends in recipe ingredients using NLP
IT students used our API in their projects. See how they analyzed the recipes section of the most visited Czech website dedicated to mothers and their babies. Finding insights about the stock market involves pretty much the same process. Read more…

Finding a needle in a haystack of text
TLDR: Anomaly detection over text data is important. Geneea offers it as a service. In Keboola Connection, it is available as well; for now, in beta version upon request. Understanding a lot of text Our clients get a lot of written feedback from their customers – support tickets, emails, or Facebook posts. For some of…
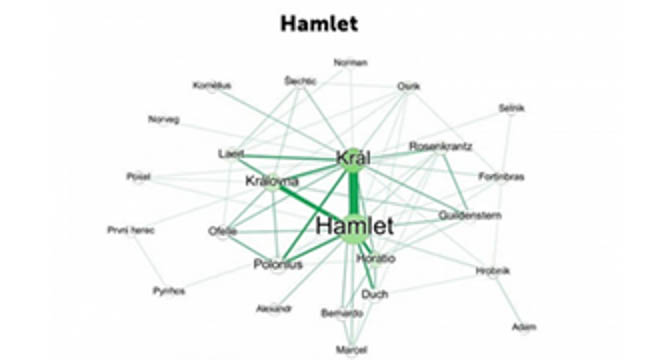
Analyzing the works of William Shakespeare
To commemorate the 400th anniversary of William Shakespeare’s death, Geneea mapped three of his best-known plays for Dotyk.cz to show what AI and text analytics can do. Read more…

Exploring the possibilities of text analytics
We gave a talk at Czech Java User Group on basic NLP functions, the way Geneea’s platform works, its training, testing, and the REST API options. We also included a few practical examples. Read more…
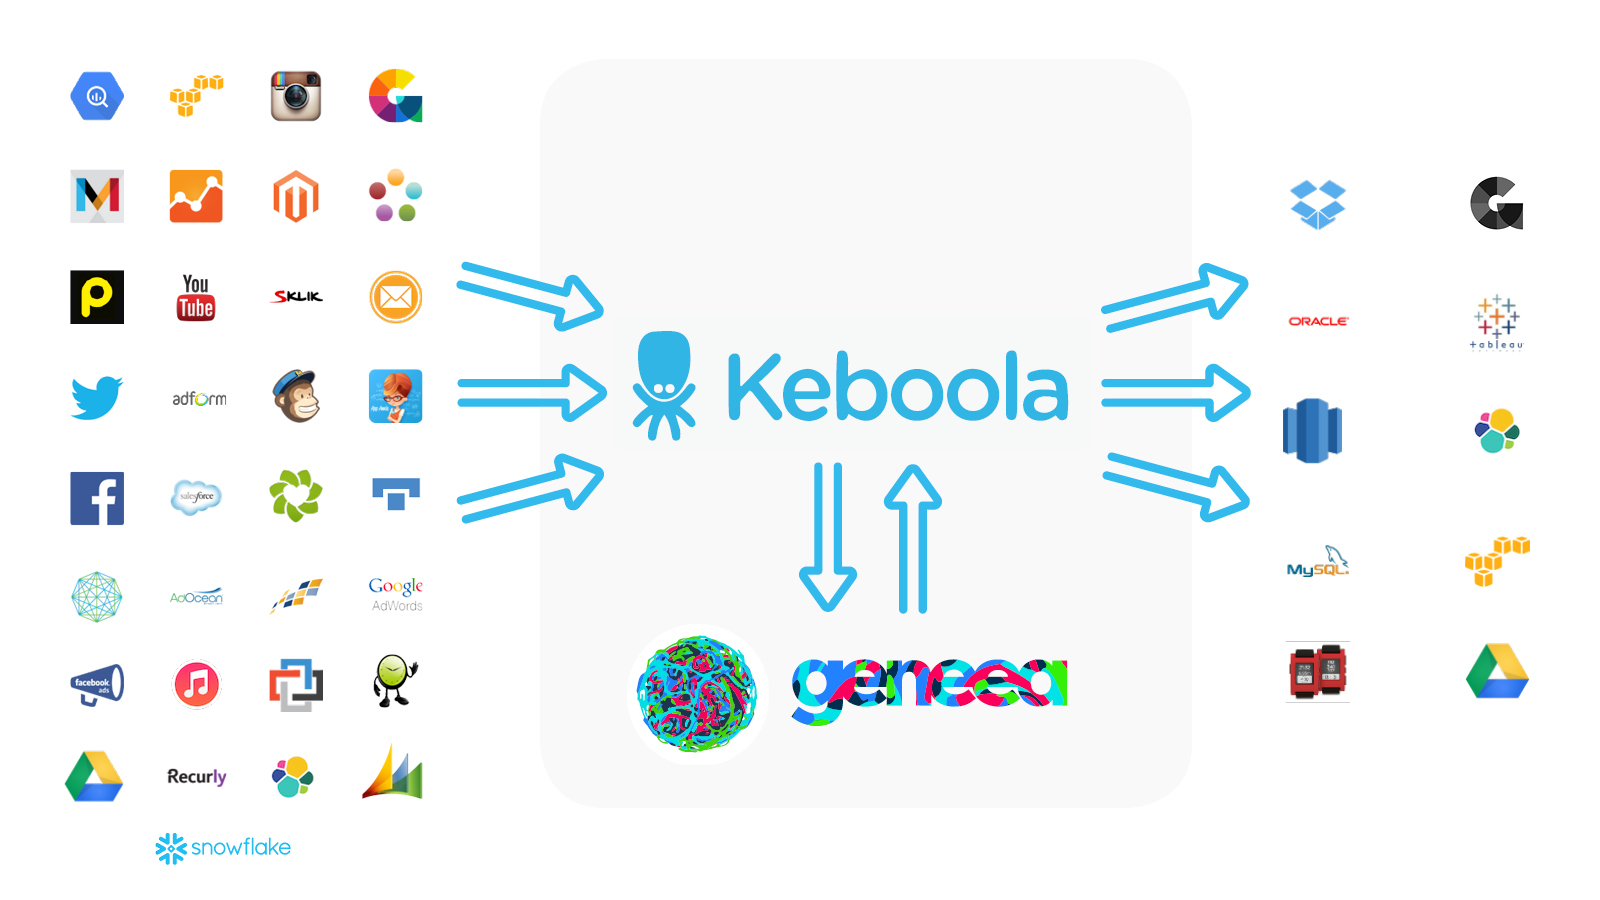
Geneea in Keboola Connection
Our NLP platform has been integrated in Keboola Connection for more than a year. In fact, we were their first 3rd-party application. What brought us together? Well, we wanted to make things easier for our users. And, let’s be honest, for ourselves, too. We have software that can do cool things: read, understand, and interpret…

Sentiment analysis of the Ice Hockey World Championships
We introduced Geneea’s text analytics engine to CZ Podcast and demonstrated what it can do by performing sentiment analysis of the Hockey World Championships in Prague and by analyzing a Czech classic—The Good Soldier Švejk.

What does Geneea think of my bike commute?
Let me show you a late autumn day example. My commute begins at this lovely technical corner. By the way, it’s located a few dozen meters from the Barrandov film studios. 🙂 Figuring out what line to take and jump over the root, or even how much the rear wheel lock will be needed to…

Quick Analysis of Sentiment in Google Sheets
Having customer support messages, tweets, or Facebook comments all in one table is helpful. There is no doubt about that. However, what’s even more useful is the ability to search the texts quickly for emotionally tinged mentions of your company. Even though everybody prefers reading positive reactions and reviews, it’s the negative ones that help…
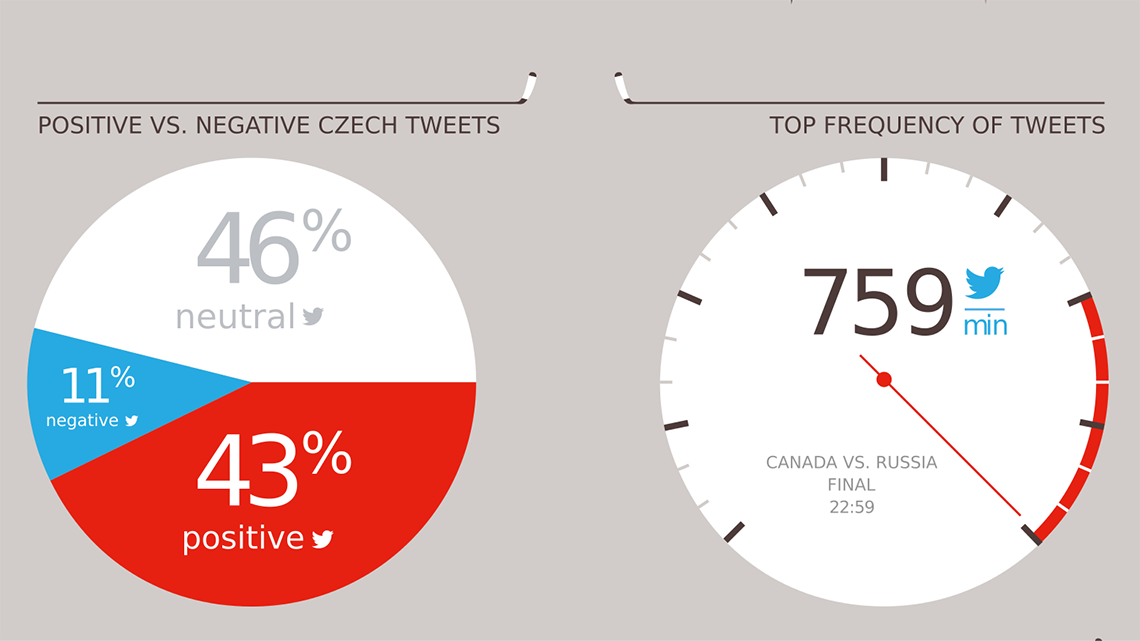
Hockey Sentiment Infographic
One can use sentiment analysis for something serious, like routing angry customer emails to senior representatives, or for something fun, like analyzing tweets about the 2015 Hockey World Cup. We have done both, but for the latter, we have created an infographic:

