Categorization
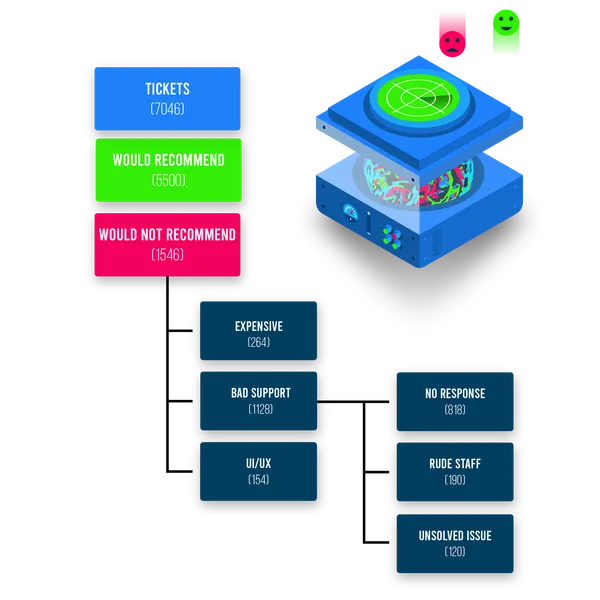
Quickly categorize all your feedback into standard or customized categories to find insights.
Understand the reasons behind NPS scores and stars in reviews with text and sentiment analytics.
With effective Voice of the Customer monitoring, you can find gaps in your customer experience, increase sales, and more effectively retain customers.
With our tools, you can easily and quickly analyze large amounts of data, whether they arise out of NPS surveys, support tickets, social media comments, feedback tools, or app store reviews. Our system can process any amount of data. It can be analyzed weekly, monthly, real-time, or in any way that suits you. If you would like to get more data, we can access and analyze your reviews from public sites like Google reviews, Tripadvisor, and more.
Quickly categorize all your feedback into standard or customized categories to find insights.
Understand the overall emotion of your customers about your brand and products.
Use automatic keyword tags for fast sorting and orientation.
Detect new trends and anomalies in your NPS score.
Our artificial intelligence can automatically code all of your feedback based on multiple categories that can be customized for your needs.
Display feedback with standard or customized categories, such as price, staff, product quality, reasons for unsubscribing, etc.
With our easy root cause analytics, you can go even deeper and display only the positive or negative feedback or really specific terms like “helpful staff” or “slow service.”
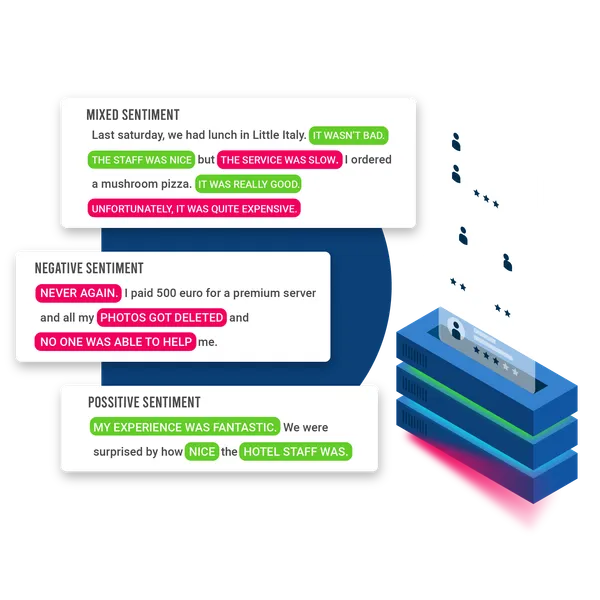
Sentiment analysis detects the emotions of the author as reflected in the text. Does the customer have positive, negative, or mixed feelings about their experience?
With our sentiment analysis, you can not only see the overall sentiment, but also the specific sentiment about your service quality, staff, products, and more.
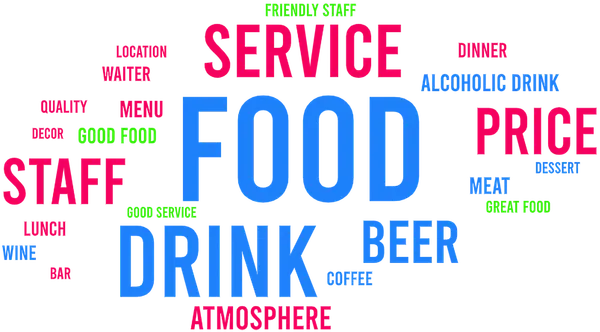
Know which topics are the most discussed based on automatic tags assigned to every NPS verbatim, review, or ticket.
You can choose a model tuned to a specific industry, such as banking, hospitality, retail, or automotive to ensure that you always get the most relevant tags.
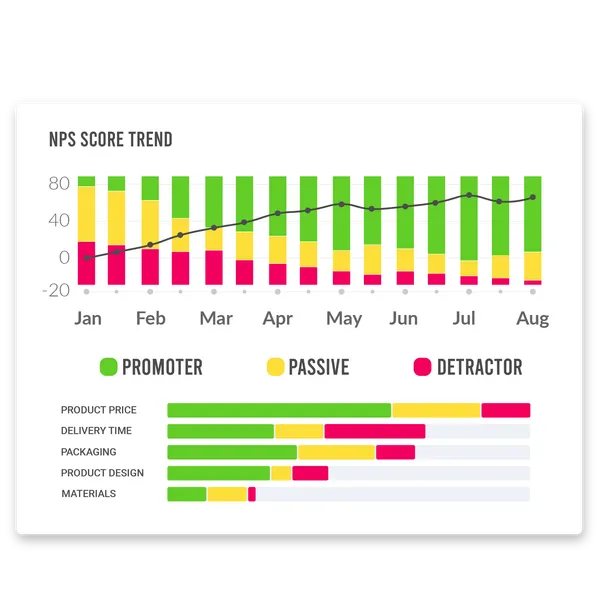
Discover new trends over time and detect anomalies. Gain the ability to easily find out what is behind them.
You can go from monitoring your NPS score over time to easily analyzing the causes of change, whether it is positive or negative.
Understanding Voice of the Customer trends is much easier with our standardized tags and industry-specific categories.
Easily analyze your Voice of the Customer and extract data from NPS, reviews, tickets, and other feedback channels.
Automatically organize the data using categories, keyword tags, and sentiments.
Visualize issues faster and cheaper while giving your agents and analysts powerful tools to detect your strong points and opportunities, and increase customer satisfaction with your brand.

Let us know what you need. Our experts will analyze your requirements and suggest the best setup. There is no commitment required from your side.

Using historical data (e.g., Google reviews), we can customize a model specifically to your needs. Or, you can choose one of our off-the-shelf solutions.

Once ready, the AI models can be accessed via our REST API or Keboola integration. Or, if you prefer, just send us Excel or CSV files whenever you need to.
We can help you to visualize and follow the most important features of verbatim feedback in tools like Tableau, Power BI, and Google Data Studio.

Heureka collects a large quantity of customer feedback on individual products and e-shops. To further enhance the user experience for their customers, Heureka needed the countless reviews to be summarized.
Read the story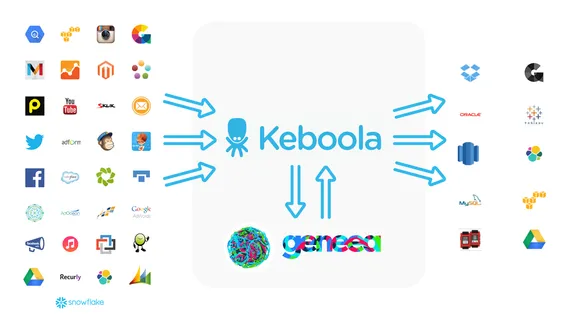
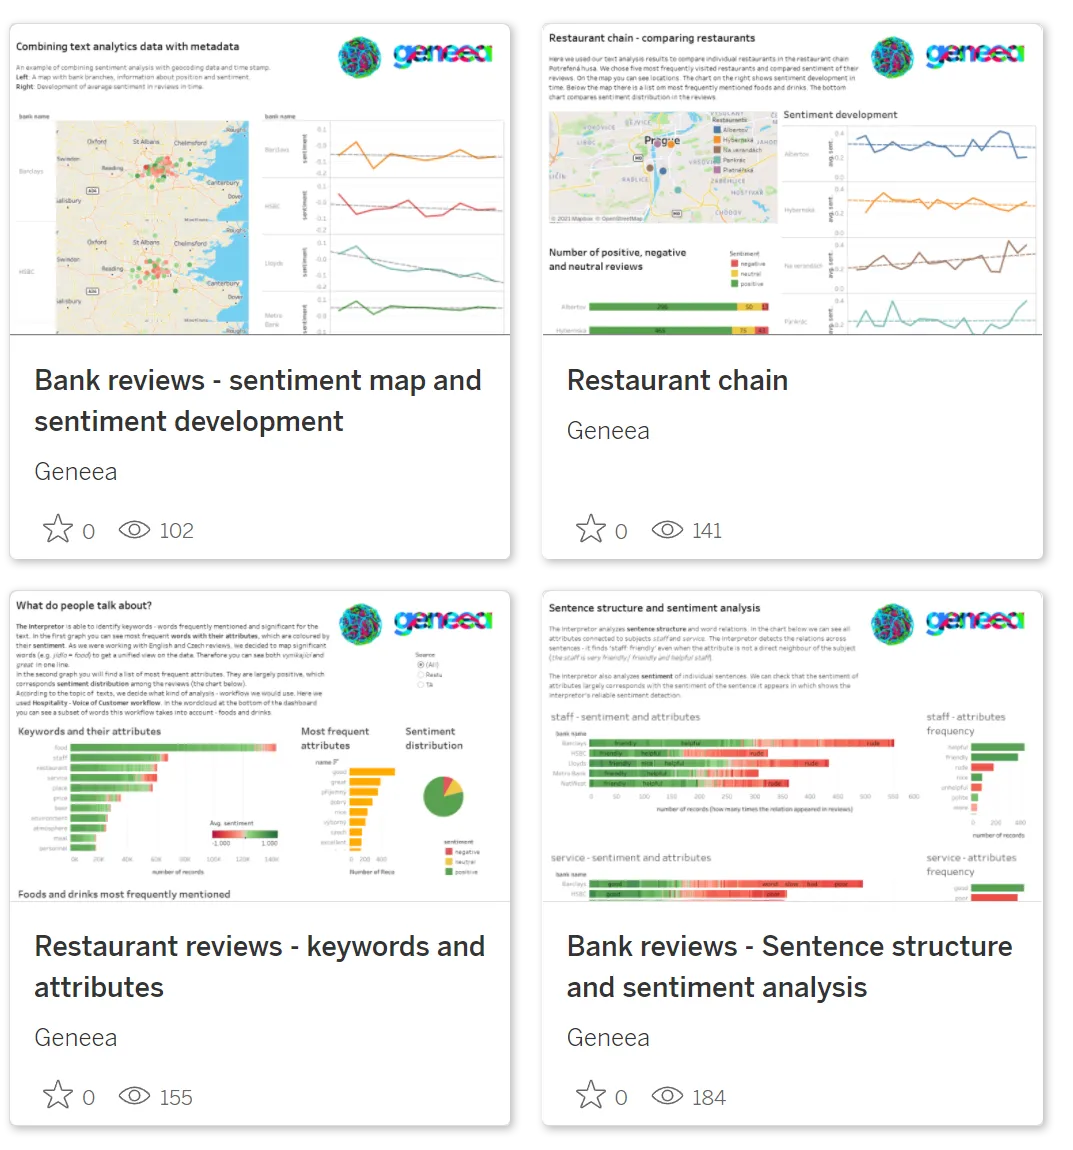
Visualizations help understanding. Our system can be easily connected with tools like Power BI, Google Data Studio, Qlik, and Tableau. This allows us to display the results of our text analytics in conjunction with other metadata on dashboards tailored to a particular audience.
Explore example visualizations
Are you curious about the aspects of iconic European landmarks that are disliked by some tourists? Dive into Apify’s blog post for a candid look at what visitors hate. Plus, don’t miss the chance to harness insights from Google reviews using our powerful text analyzer on the Apify platform. Are you ready to uncover some...
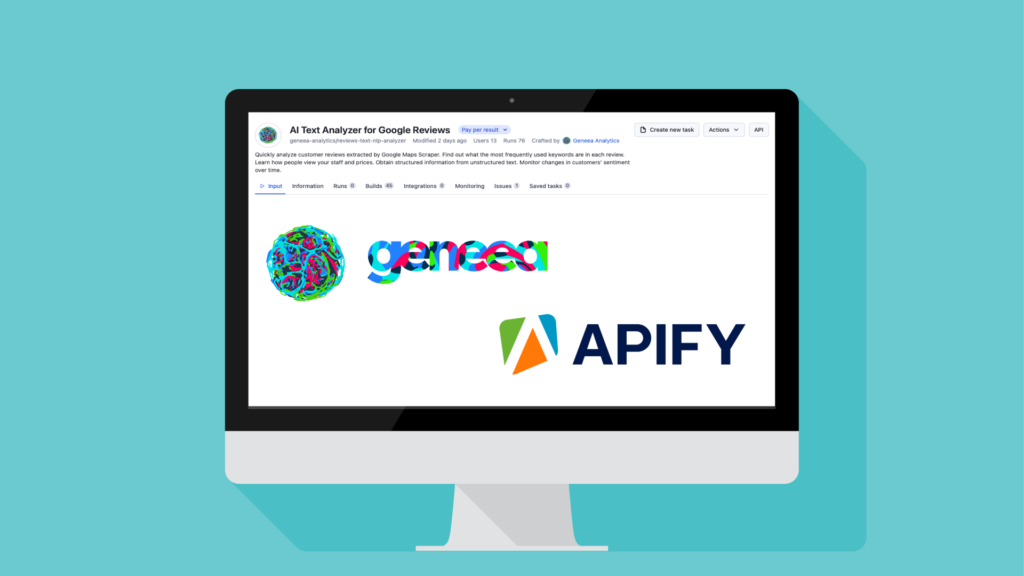
Looking to uncover valuable insights from Google Reviews about your business or your competitors? Look no further! Geneea has integrated its own actor into Apify’s web scraping and automation platform. Our actor is designed to analyze Google reviews, providing you with tags, attributes, and sentiment for each review. It is easy to visualize the resulting...
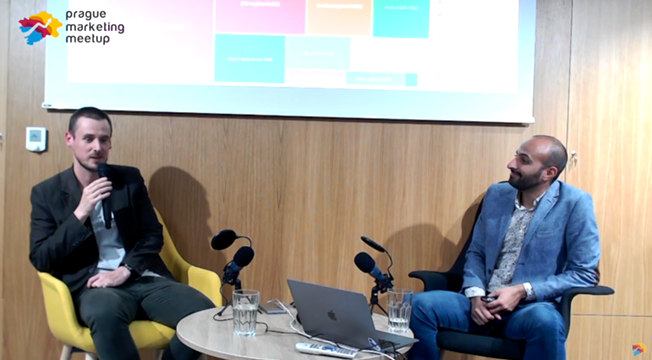
We were pleasantly surprised when Bretislav S., Head of Business Intelligence at Dáme jídlo, discussed his company’s cooperation with Geneea and the benefits and possibilities of text analytics, specifically the analysis of customer reviews.